OpenMetrics (e.g. Prometheus)
OpenMetrics is an open standard for exposing metrics data (numerical time series) in a text-based format over HTTP. Originally developed by the Prometheus community, several other observability platforms also accept this format, including Grafana Mimir, VictoriaMetrics, Thanos, InfluxDB, Datadog, and New Relic.
Halon provides metrics via the Monitor interface that Prometheus can pull directly; cron export jobs to push the stats are no longer needed.
You can also define custom metrics that are driven by your own code - see Custom Metrics.
In the Halon startup configuration, you can configure the monitor interface to listen on a specific IP address. This is sufficient when your MTA has an internal network interface. However it's generally good practice to secure it. The startup configuration defines private keys and certificates.
Secure the monitor interface
In this example, the host has a valid private key and certificate obtained from letsencrypt using certbot. The private key remains the same, and is set up in the startup configuration. Certbot renews the certificate periodically, calling config hook points to reload the running configuration. Detailed steps are shown here.
We chose port 9090 as it's commonly used with Prometheus.
pki:
  private:
    - id: my_cert
      privatekey:
        path: /etc/letsencrypt/live/send01.engage.halon.io/privkey.pem

# openmetrics - usual listener
monitor:
  listener:
    port: 9090
  type: https
In the Halon running configuration, the certificate is defined in pki.private[] , using the same id.
We'll also require the client to present a valid X-Api-Key header containing a secret value.
pki:
  private:
    - id: my_cert
      certificate:
        path: /etc/letsencrypt/live/send01.engage.halon.io/fullchain.pem

# openmetrics - usual listener
monitor:
  tls:
    certs:
      cert: my_cert
  type: https
  apikeys:
    - your_secret # CHANGE THIS
Test with curl
Following a service restart, from another host, test the endpoint is responding correctly using curl.
curl https://send01.engage.halon.io:9090/metrics --header "X-Api-Key: your_secret"
You should see a text response of 500+ lines, comprising #TYPE and #HELP lines followed by each metric value:
# TYPE halon_monitor_ready gauge
# HELP halon_monitor_ready The current ready status (ready=1, notready=0)
halon_monitor_ready 1
# TYPE halon_monitor_healthy gauge
# HELP halon_monitor_healthy The current health status (healthy=1, unhealthy=0)
halon_monitor_healthy 1
The monitor interface is now working. The rest of this article shows a way to use it.
Install Grafana, Prometheus, and nginx
If setting up for the first time, ensure you have a recent version of Grafana, Prometheus, and nginx. On Ubuntu systems:
apt install -y grafana prometheus nginx
Prometheus does not directly support custom headers such as X-Api-Key in its scrape configs. However it is easy to use nginx as an outbound proxy to add the header. The overall flow in this setup is:
Configure nginx
In /etc/nginx/nginx.conf, add this local-only server. We set up one location for each each monitored Halon instance.
http {
 server {
  listen localhost:9200;

   # Proxies for each Halon instance
   location /metrics/send01 {
    proxy_pass https://send01.engage.halon.io:9090/metrics;
    proxy_set_header X-Api-Key your_secret;
    proxy_ssl_server_name on;
   }

   location /metrics/send02 {
    proxy_pass https://send02.engage.halon.io:9090/metrics;
    proxy_set_header X-Api-Key your_secret;
    proxy_ssl_server_name on;
   }

   location /metrics/send03 {
    proxy_pass https://send03.engage.halon.io:9090/metrics;
    proxy_set_header X-Api-Key your_secret;
    proxy_ssl_server_name on;
   }
 }
Recommended: validate your config with nginx -t. You should see a message indicating your config is OK, then restart nginx.
Configure Prometheus
In /etc/prometheus/prometheus.yml, add the scrape configuration. Here we have three jobs, one per Halon instance. Each job periodically polls a distinct plain HTTP metrics_path, which is forwarded by nginx to Halon over HTTPS, with the X-Api-Key header added.
global:
  scrape_interval: 15s # Optional; set the scrape interval to every 15 seconds. Default is every 1 minute.

scrape_configs:
  - job_name: "send01"
    metrics_path: /metrics/send01
    static_configs:
      - targets: ["localhost:9200"]

  - job_name: "send02"
    metrics_path: /metrics/send02
    static_configs:
      - targets: ["localhost:9200"]

  - job_name: "send03"
    metrics_path: /metrics/send03
    static_configs:
      - targets: ["localhost:9200"]
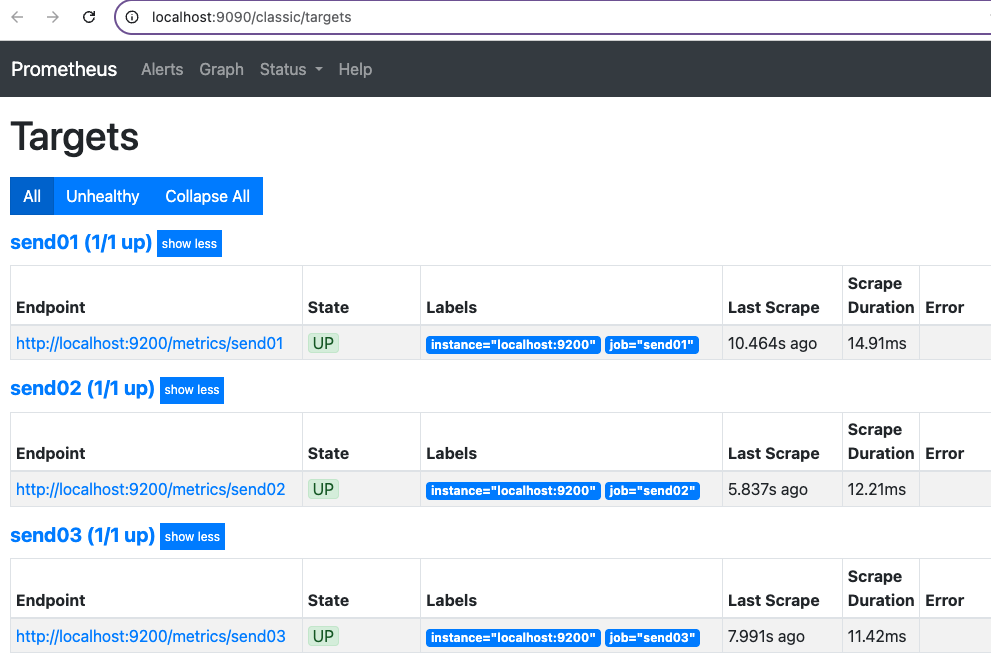
Optional: on the Prometheus UI, you can see the state of these jobs. They should be "up".

As the Prometheus UI is not password-protected, block its port in your incoming firewall. You can still view it using local port forwarding: ssh -L 9090:localhost:9090 user@remote-server.
We now add Prometheus as a data source in Grafana, our chosen monitoring UI.
Configure Grafana
The Grafana web UI has username and password authentication. When freshly installed, the default user is admin with password admin which you should change in the UI.
Secure Grafana web UI
You can configure Grafana to provide the web UI over HTTPS directly. However, when using Letsencrypt / Certbot, it's convenient to use nginx, as Certbot knows how to interact with nginx for certificate renewal. Add the following to /etc/nginx/nginx.conf, updating to suit your server_name and key/certificate paths.
 server {
  listen 80;
  server_name grafana.engage.halon.io;
   return 301 https://$host$request_uri;
 }

 # HTTPS block
 server {
  listen 443 ssl;
  server_name grafana.engage.halon.io;

  ssl_certificate /etc/letsencrypt/live/grafana.engage.halon.io/fullchain.pem;
  ssl_certificate_key /etc/letsencrypt/live/grafana.engage.halon.io/privkey.pem;
  include /etc/letsencrypt/options-ssl-nginx.conf;
  ssl_dhparam /etc/letsencrypt/ssl-dhparams.pem;

   location / {
    proxy_pass http://localhost:3000/;
    proxy_set_header Host $host;
    proxy_set_header X-Real-IP $remote_addr;
    proxy_set_header X-Forwarded-For $proxy_add_x_forwarded_for;
    proxy_set_header X-Forwarded-Proto $scheme;
    proxy_redirect off;
   }
 }
}
Now you can block port 3000 in your incoming firewall, and access Grafana via standard web ports.
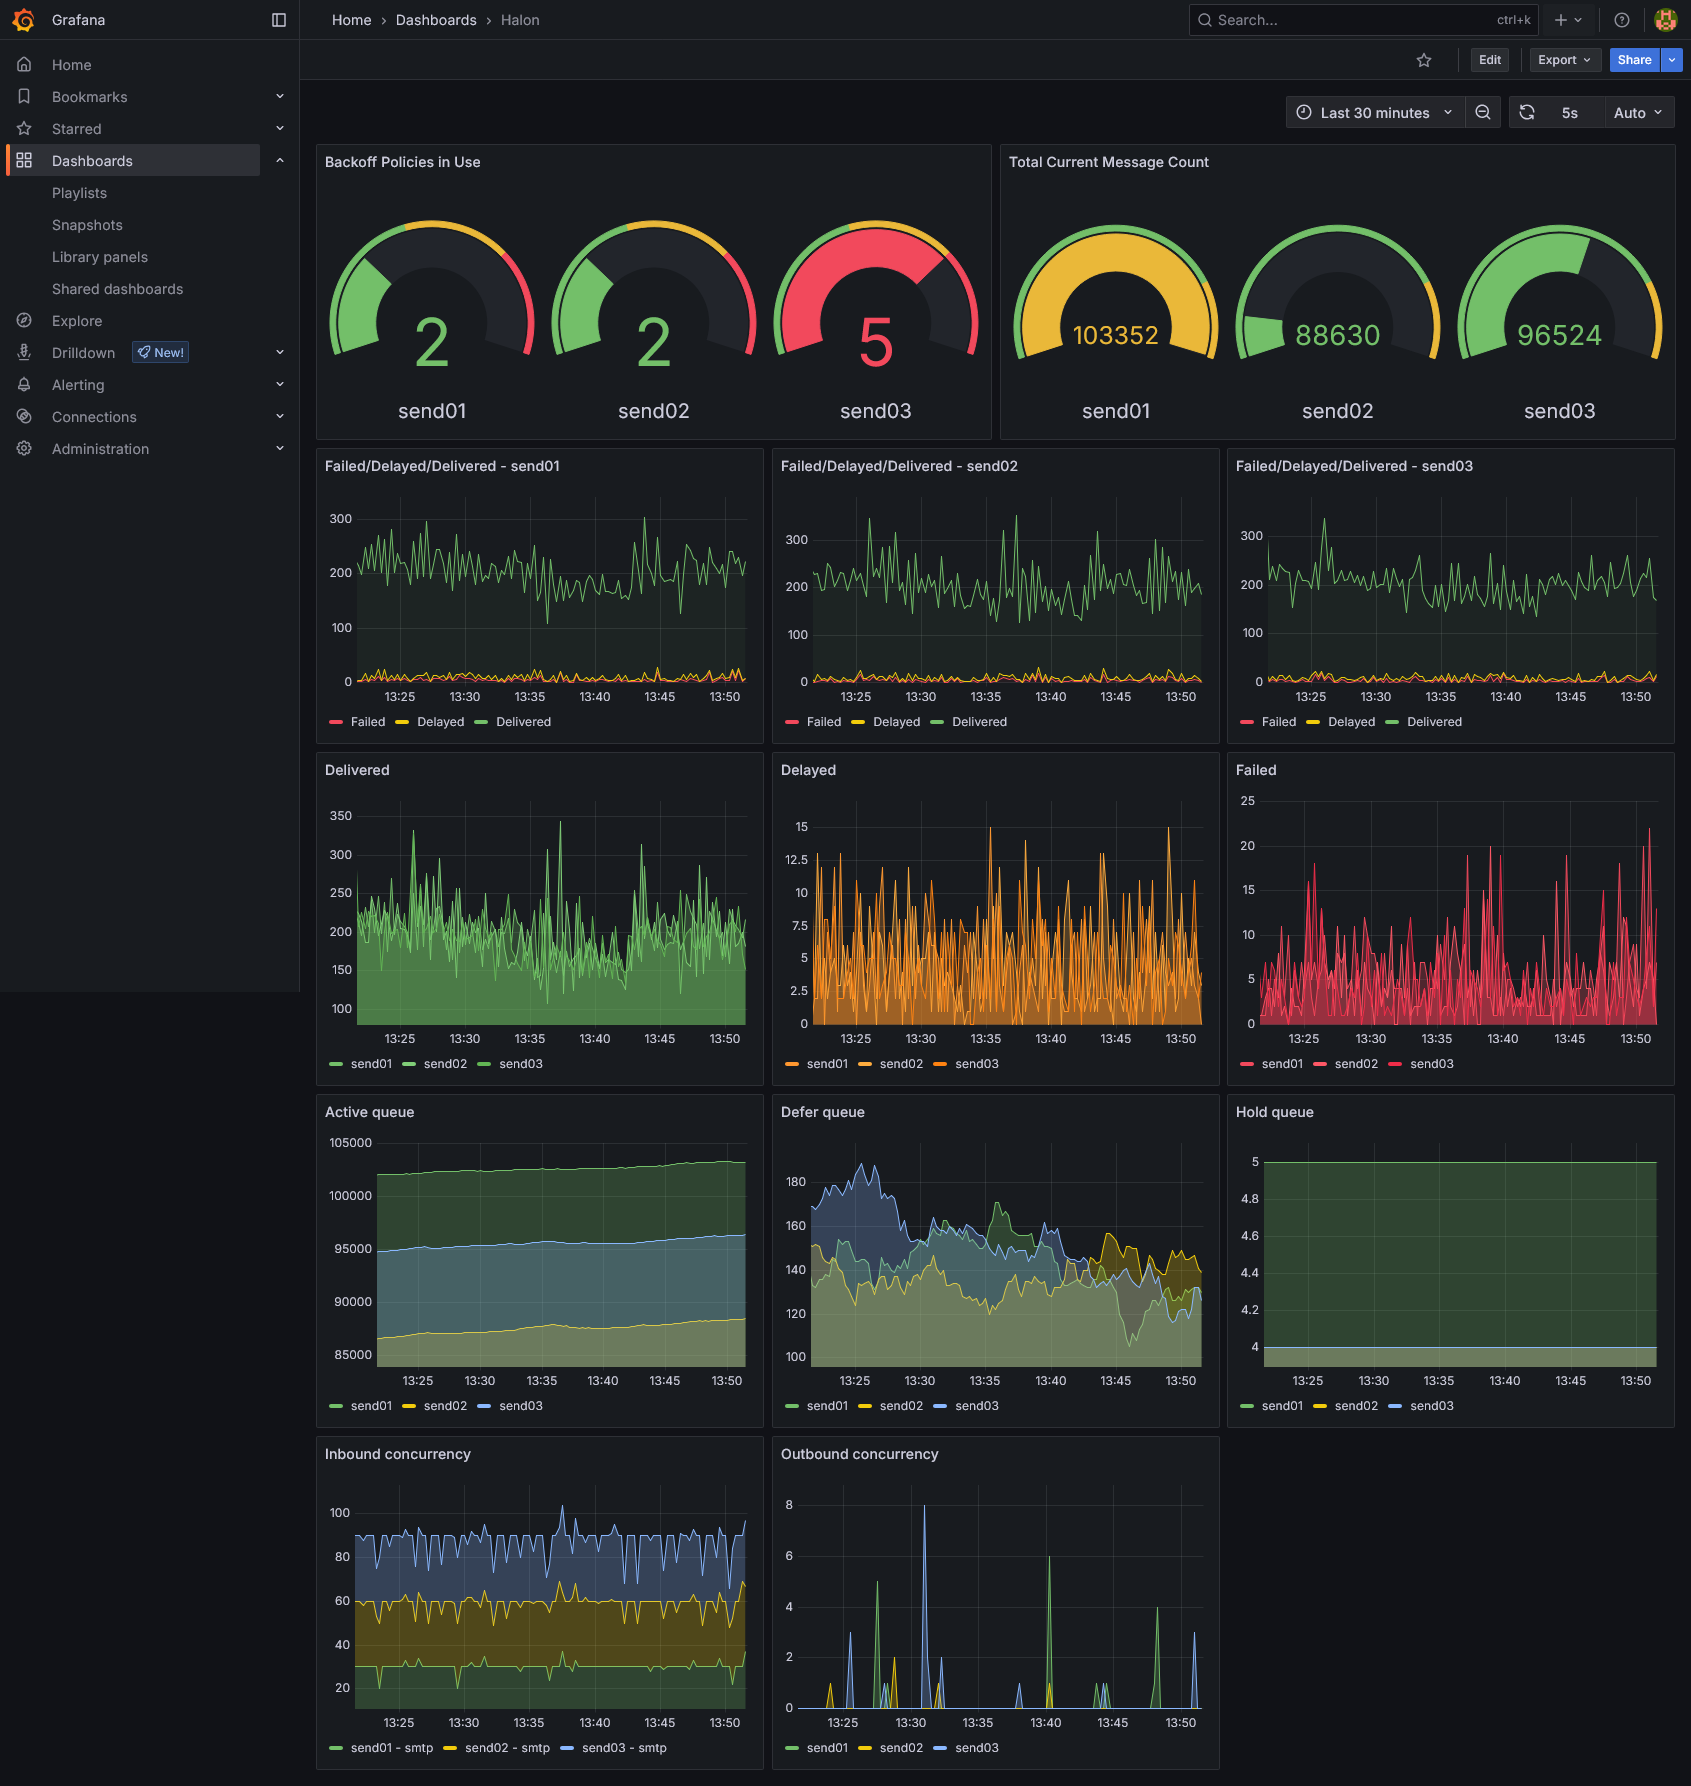
Grafana dashboard
Halon metrics provide:
- counters (values that monotonically increase while the service is running, set to zero on restart)
- gauges (values that go up and down).
These can be combined into a dashboard with various UI visualization panel types.

A sample dashboard is available here to download and customize.