Custom metrics
Halon has a comprehensive set of standard metrics that are presented in OpenMetrics format.
These can be extended by defining your own custom monitor.metrics in the running configuration, and updating them via HSL script functions metrics_increment, metrics_decrement and metrics_set.
Each metric can be of type:
- counter (value that monotonically increases while the service is running, set to zero on restart)
- gauge (value that can go up and down)
- histogram (samples observations—like request durations—and counts them in configurable buckets; also tracks the total sum and count of all observations)
In this article, we define two example metrics, with HSL code to update them:
- a counter for inbound SMTP authorization failures
- a histogram for the time that messages spent in the queue prior to a successful delivery, broken down by transportid and grouping.
Define custom metrics in running configuration
The authfail counter is straightforward. We add some defined help text for it.
For the time_in_queue histogram, we choose a set of buckets that the time will be measured in.
Typically some messages are delivered quickly (sub-second). Others may incur retries and take minutes or hours to deliver. We don't need high resolution for the longer time periods, so we choose buckets that are fine-grained for fast times, and get wider for the slower times. Anything taking longer will fall into a final bucket, that the system automatically provides.
# OpenMetrics - usual listener
monitor:
  // existing configuration is here
  metrics:
    - name: authfail
      type: counter
      help: "Number of authentication failures"

    - name: time_in_queue
      type: histogram
      help: "The time messages spent in the queue before delivery, in seconds"
      buckets:
        - 0.5
        - 1
        - 2
        - 5
        - 10
        - 20
        - 30
        - 60
        - 120
        - 240
        - 500
        - 1800
        - 3600
        - 7200
        - 14400
        - 28800
        - 86400
Update metrics values dynamically in HSL
Here are some simple code snippets to drive these metrics.
In your SMTP auth hook, in the failure code path, add:
metrics_increment("authfail", []); // no labels for a simple counter
In your Queue postdelivery hook in your successful delivery code path, add:
// Histogram
$time_in_queue = time() - $message["ts"];
metrics_set("time_in_queue", [
    "transportid" => $transportid,
    "grouping" => $args["grouping"],
], $time_in_queue);
This picks up the message transportid and grouping, passing them as a label. This causes the metric to be updated and reported individually for each combination of transportid and grouping.
If you just want an overall measure of time in queue - without metric labelling by transportid and grouping - you can simply omit those parameters and pass in [], like the authfail example.
Verify and update your Halon configuration in the usual way. A service restart is not needed.
halonconfig && cp dist/*.yaml /etc/halon && halonctl config reload
Output
You don't need to see this when using a graphical reporting tool such as Grafana, but it helps to be aware of the underlying data format.
Here is raw sample output pulled directly from the OpenMetrics endpoint using curl, using grep to filter to show particular values. First, the authfail counter, showing two failed attempts:
curl -s https://test.engage.halon.io:9090/metrics --header "X-Api-Key: your_secret" | grep "authfail"
# TYPE authfail counter
# HELP authfail Number of authentication failures
authfail 2
Here's part of the time_in_queue histogram (the full output is large):
curl -s https://test.engage.halon.io:9090/metrics --header "X-Api-Key: your_secret" | grep "time_in_queue"
# TYPE time_in_queue histogram
# HELP time_in_queue The time messages spent in the queue before delivery, in seconds
time_in_queue_bucket{transportid="gold",grouping="&google",le="0.5"} 16648
time_in_queue_bucket{transportid="gold",grouping="&google",le="1"} 16734
time_in_queue_bucket{transportid="gold",grouping="&google",le="2"} 16738
time_in_queue_bucket{transportid="gold",grouping="&google",le="5"} 16904
time_in_queue_bucket{transportid="gold",grouping="&google",le="10"} 17017
time_in_queue_bucket{transportid="gold",grouping="&google",le="20"} 17031
time_in_queue_bucket{transportid="gold",grouping="&google",le="30"} 17033
time_in_queue_bucket{transportid="gold",grouping="&google",le="60"} 17034
time_in_queue_bucket{transportid="gold",grouping="&google",le="120"} 17070
time_in_queue_bucket{transportid="gold",grouping="&google",le="240"} 17070
time_in_queue_bucket{transportid="gold",grouping="&google",le="500"} 17081
time_in_queue_bucket{transportid="gold",grouping="&google",le="1800"} 17087
time_in_queue_bucket{transportid="gold",grouping="&google",le="3600"} 17091
time_in_queue_bucket{transportid="gold",grouping="&google",le="7200"} 17091
time_in_queue_bucket{transportid="gold",grouping="&google",le="14400"} 17093
time_in_queue_bucket{transportid="gold",grouping="&google",le="28800"} 17093
time_in_queue_bucket{transportid="gold",grouping="&google",le="86400"} 17093
time_in_queue_bucket{transportid="gold",grouping="&google",le="+Inf"} 17093
time_in_queue_count{transportid="gold",grouping="&google"} 17093
time_in_queue_sum{transportid="gold",grouping="&google"} 37570.5
This is showing generally fast delivery, with the great majority of messages taking less than one second.
Note that the buckets are of the type le="nn", i.e. they accumulate all values less than or equal to the threshold. The final bucket le="+Inf" is the catch-all.
As well as the histogram values, you have:
count- number of occurrences - in this case, messages.sum- running total of the values measured - in this case, time in queue.sum / counttherefore gives you the meantime_in_queue- from the above, we can calculate a mean time of 2.2 seconds.
Grafana
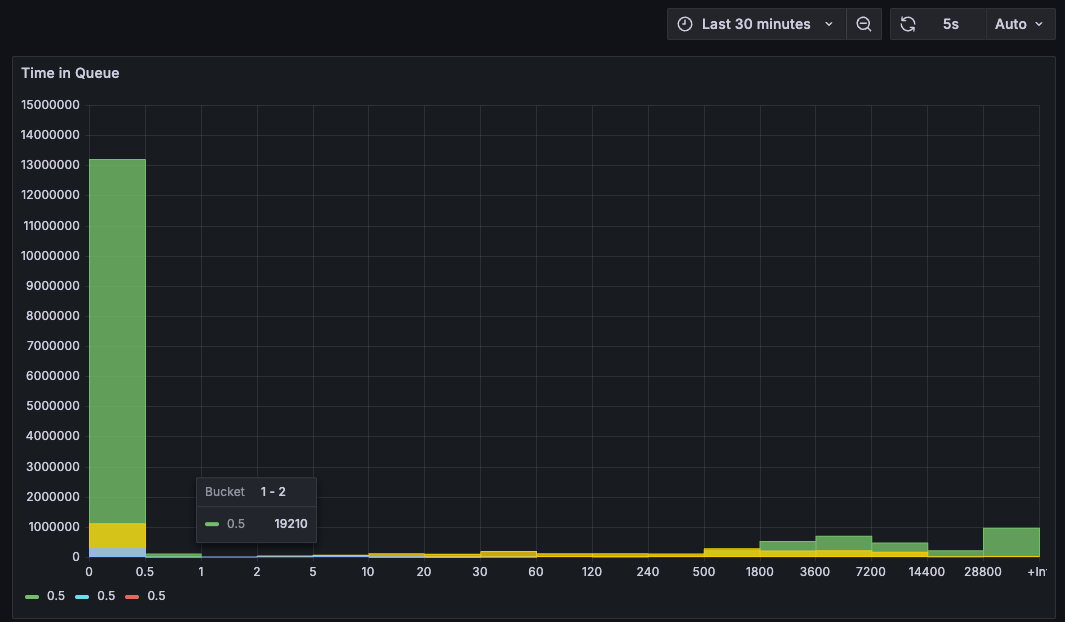
Grafana can provide visualizations of custom metrics, such as this.

See this introductory article on getting started with Openmetrics/Prometheus.