5.5. Statistics and information
Shows information about process statistics (cache hits, internal queue sizes) and other information such as email queue size.
5.5.1. halontop
The halontop program shows a visual view of all counters with live updates and rates calculations.
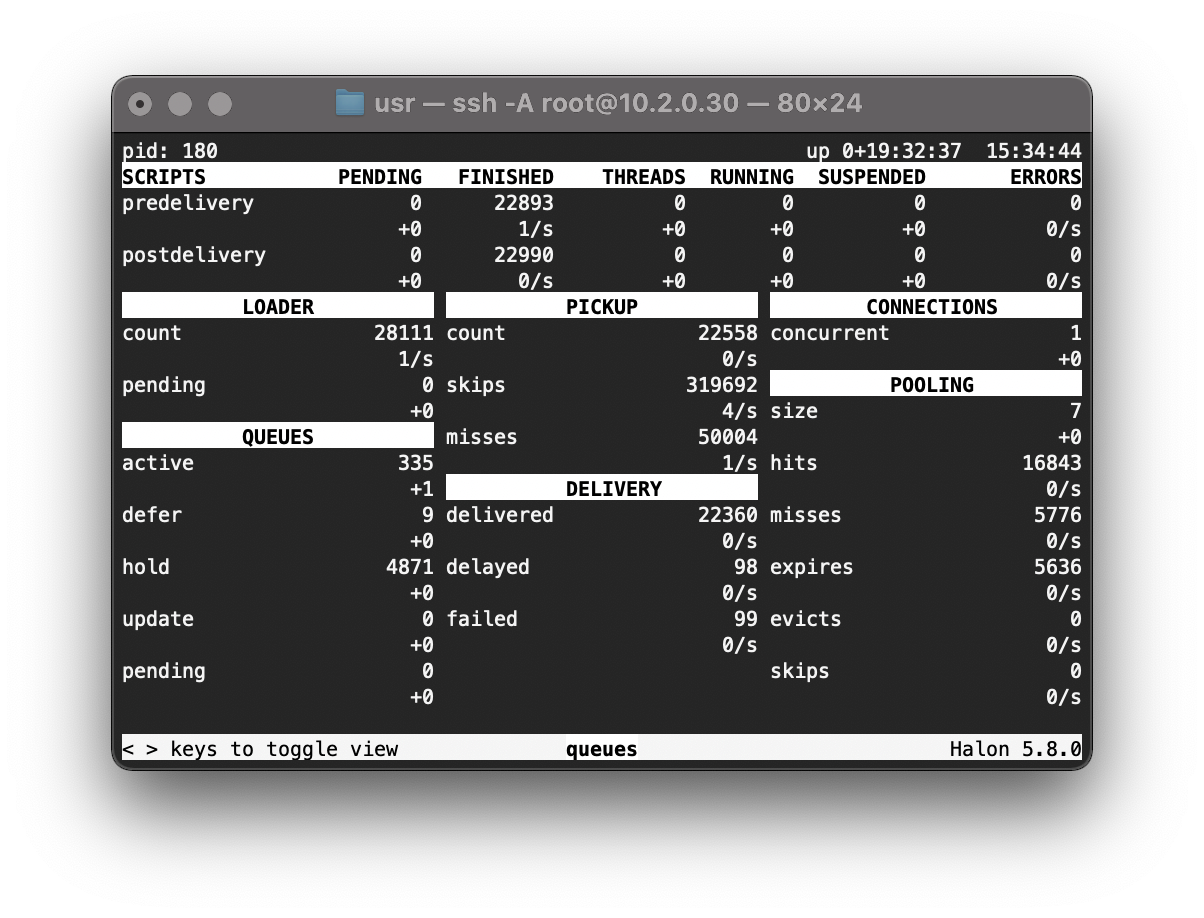
The first line shows the process ID, smtpd process uptime and current host time. Values in blue show the difference between the previous value and the current value, e.g. +6, -6.
Navigate between panes showing the following sections, using < > cursor keys.
- SERVERS
Name, number of inbound connections, percentage occupied.
- SCRIPTS
For each type of script hook, how many are running, finished, and pending to be executed. Also shows script errors, if any. The pre-delivery and post-delivery hooks are queue actions when delivering outbound messages. The others relate to phases of the inbound SMTP conversations. Non-zero numbers in the “pending” state show you have messages that cannot run the script hook yet. High counts can indicate the need for Performance tuning.
- THREADS
The script thread activity broken down by thread pool name. “_default” and “_queues” are the standard names.
- LOADER
Count, pending and active counts. Messages coming into the queue, on a well running system will correlate with the injection rate. High “pending” values indicate a possible disk performance issue.
- QUOTA
Size.
- QUEUES
Active (priority 0 and 1), defer, hold, update and pending message counts.
- POLICIES / DYNAMIC
Count of suspends and conditions.
- PICKUP
Count of total messages picked up, skips, misses, pending and evals.
- POLICIES / CONCURRENCY
Outbound connection concurrency: suspends and counters.
- POLICIES / RATE
Outbound rate limiting: suspends and buckets.
- CONNECTIONS
Outbound connection concurrency, as a count and percentage of total.
- POOLING
Outbound connection pooling size, hits, misses, expires, evicts and skips.
- DELIVERY
Delivered, delayed and failed (since last restart).
- RELEASE
Pending count.
- RESOLVER
Running, pending and dedup counts. High “pending” counts may indicate a problem with DNS reolution.
- RESOLVER CACHE
Size, hits, misses, expires, evicts and skips.
- DOMAIN CACHE
Size, hits, misses, expires, and evicts.
5.5.2. halonctl process-stats
Text based output for counters may be extracted using halonctl suited for data collection.
$ halonctl process-stats
process.pid: 48535
process.runtime: 3638
...
Output can be native text (default), JSON or OpenMetrics format:
$ halonctl process-stats --help
Show smtpd process information
Usage: /opt/halon/bin/halonctl.bin process-stats [OPTIONS]

Options:
-h,--help                   Print this help message and exit
--json Excludes: --openmetrics
                            Dump response as JSON
--json-request              Dump request as JSON
--openmetrics Excludes: --json
                            Dump response as OpenMetrics
OpenMetrics format can be used directly with monitoring tools such as Prometheus and Kibana.
The output is self-describing, with # TYPE, # HELP and # UNIT metadata directives; see Metrics summary.