# Statistics and information
Shows information about process statistics (cache hits, internal queue sizes)
and other information such as email queue size.
## halontop
The *halontop* program shows a visual view of all counters with live updates and rates calculations.
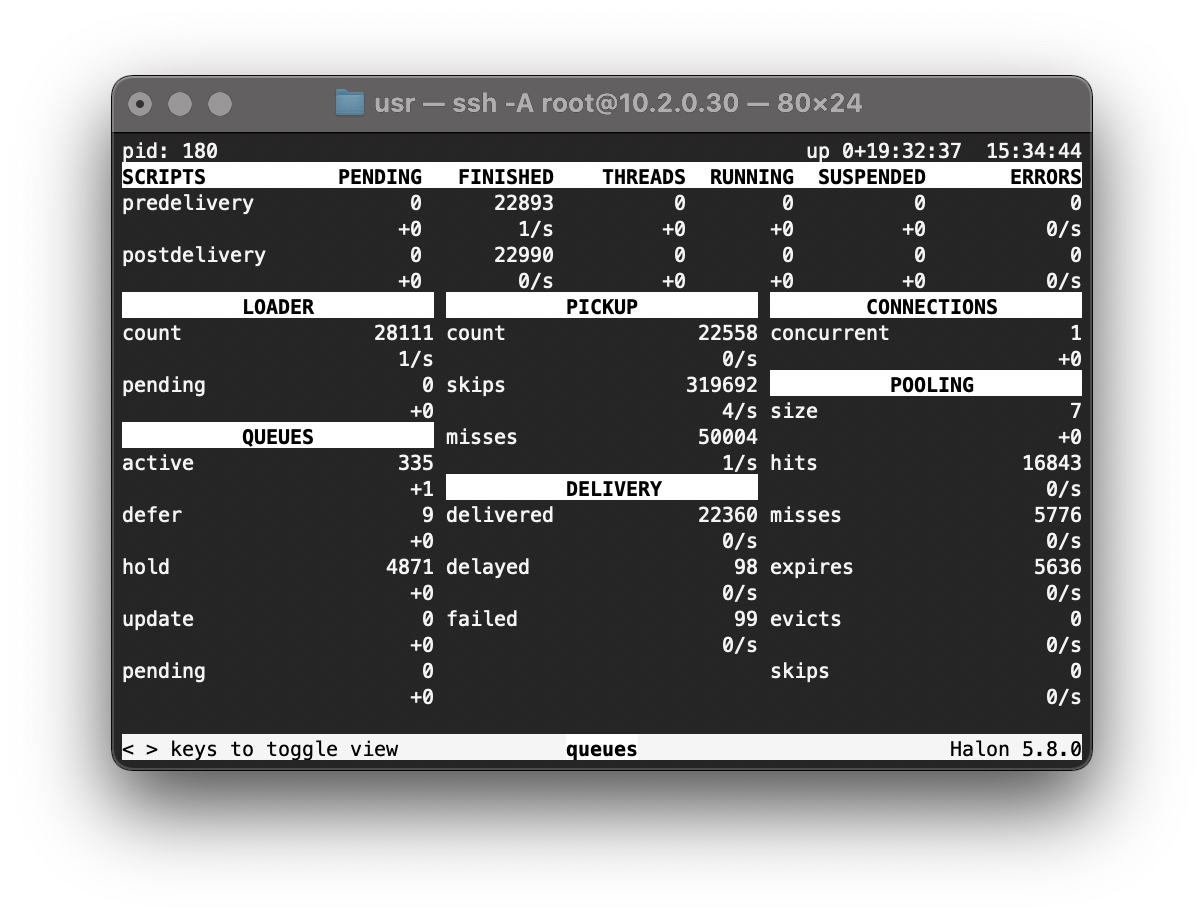
The first line shows the process ID, `smtpd` process uptime and current host time. Values in blue show the difference between the previous value and the current value, e.g. +6, -6.
Navigate between panes showing the following sections, using `<` `>` cursor keys.
SERVERS
: Name, number of inbound connections, percentage occupied.
SCRIPTS
: For each type of script hook, how many are running, finished, and pending to be executed.
Also shows script errors, if any.
The pre-delivery and post-delivery hooks are queue actions when delivering outbound messages.
The others relate to phases of the inbound SMTP conversations.
Non-zero numbers in the “pending” state show you have messages that cannot run the script hook yet. High counts can indicate the need for [Performance tuning](config_tuning.html.md).
THREADS
: The script thread activity broken down by thread pool name. “_default” and “_queues” are the standard names.
LOADER
: Count, pending and active counts. Messages coming into the queue, on a well running system will correlate with the injection rate.
High “pending” values indicate a possible disk performance issue.
QUOTA
: Size.
QUEUES
: Active (priority 0 and 1), defer, hold, update and pending message counts.
POLICIES / DYNAMIC
: Count of suspends and conditions.
PICKUP
: Count of total messages picked up, skips, misses, pending and evals.
POLICIES / CONCURRENCY
: Outbound connection concurrency: suspends and counters.
POLICIES / RATE
: Outbound rate limiting: suspends and buckets.
CONNECTIONS
: Outbound connection concurrency, as a count and percentage of total.
POOLING
: Outbound connection pooling size, hits, misses, expires, evicts and skips.
DELIVERY
: Delivered, delayed and failed (since last restart).
RELEASE
: Pending count.
RESOLVER
: Running, pending and dedup counts. High “pending” counts may indicate a problem with DNS reolution.
RESOLVER CACHE
: Size, hits, misses, expires, evicts and skips.
DOMAIN CACHE
: Size, hits, misses, expires, and evicts.
## halonctl process-stats
Text based output for counters may be extracted using *halonctl* suited for data collection.
```console
$ halonctl process-stats
process.pid: 48535
process.runtime: 3638
...
```
Output can be native text (default), JSON or OpenMetrics format:
```console
$ halonctl process-stats --help
Show smtpd process information
Usage: /opt/halon/bin/halonctl.bin process-stats [OPTIONS]
Options:
-h,--help Print this help message and exit
--json Excludes: --openmetrics
Dump response as JSON
--json-request Dump request as JSON
--openmetrics Excludes: --json
Dump response as OpenMetrics
```
[OpenMetrics](https://openmetrics.io/) format can be used directly with monitoring tools such as [Prometheus](https://prometheus.io/) and [Kibana](https://www.elastic.co/kibana).
The output is self-describing, with `# TYPE`, `# HELP` and `# UNIT` metadata directives; see [Metrics summary](openmetrics.html.md).